SigmaPlot 8.0 Makes Analyzing and Presenting Your Data Easier Than Ever!
New Features in SigmaPlot 8.0:
Run from Excel
Graph editing toolbar palettes
On-page text editing
Lock legend text
Multiple Undo, Autosave, Nudge and more
Instantly access SigmaPlot from Microsoft Excel

Combine two powerful packages. Launch the SigmaPlot Graph Wizard from Microsoft Excel's toolbar or menu, then select the row and column references in Excel worksheet format.
Click to view larger image
Launch SigmaPlot's Graph Wizard directly from Microsoft Excel without transferring files or cutting and pasting data. Use date/time formats and data derived from in-cell formulas. Then, click on the graph in your Microsoft Excel worksheet to call up SigmaPlot's graph editing dialog box. Embed SigmaPlot graphs in Microsoft Excel worksheets automatically to keep your raw data and graphs in one file.?
- Call the SigmaPlot Graph Wizard directly from Excel to eliminate tedious cut and paste steps.
- Create your graph using your active Excel worksheet, so there's no need to worry about date and time formats changing unexpectedly, or losing data derived from in-cell formulas and macros.
- Automatically generate professional graphs embedded in Excel worksheets to keep your raw data and graphs in one handy file
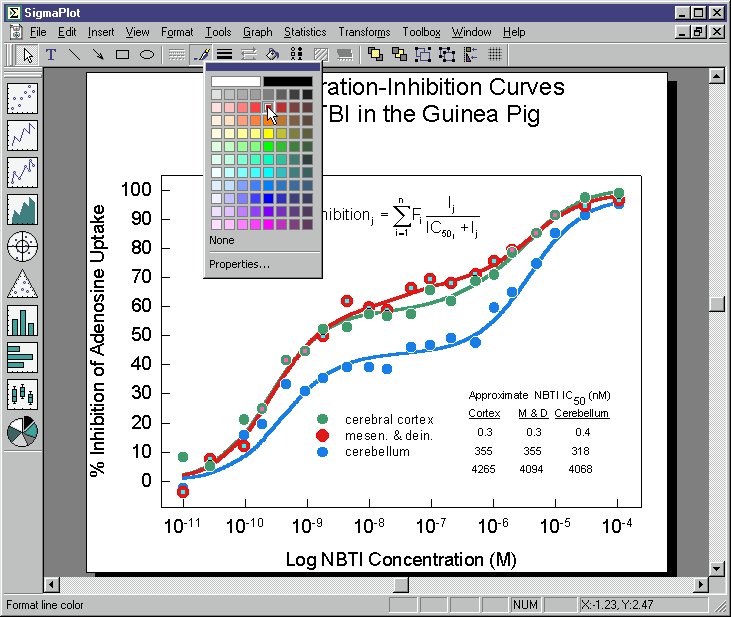
Get more editing flexibility with new toolbar palettes
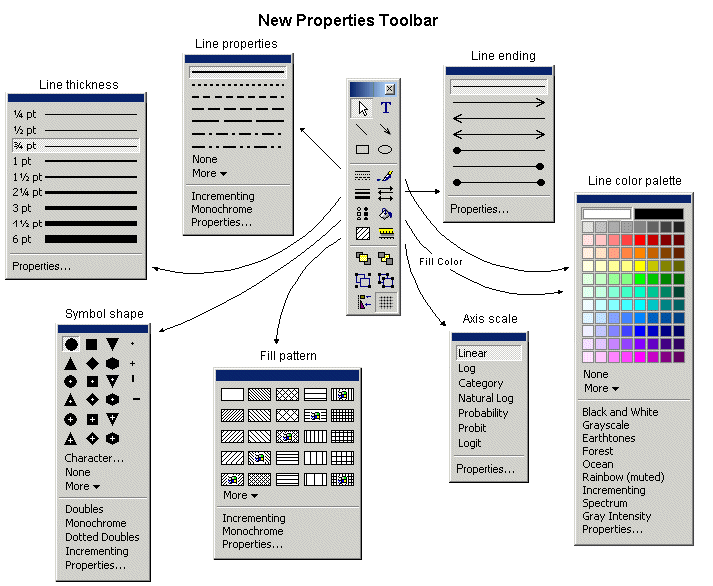
New toolbar palettes in SigmaPlot 8.0 enable you to work more efficiently. Change graph elements quickly and apply changes to multiple or individual selections.
Click to view larger image
SigmaPlot 8.0 delivers more editing flexibility with new toolbar palettes. Modify object properties directly from the toolbar using drop-down palettes. Changing graph elements is faster and easier than ever! ?Modify graph objects such as lines, symbols, line thickness and more directly from new toolbar palettes. ?Apply changes to multiple selections - set properties such as line thickness, tick lengths, fonts for all graphs on a page. Edit individual objects on your graph, such as individual bars and lines, to highlight groups.
- Selectively edit objects on your graph, such as individual bars and lines, to highlight groups.
- Modify multiple selections simultaneously to save unnecessary steps.
- Change colors, modify line thickness, add fills and other annotations using handy toolbar palettes in the main toolbar.
Edit text directly on your graphs
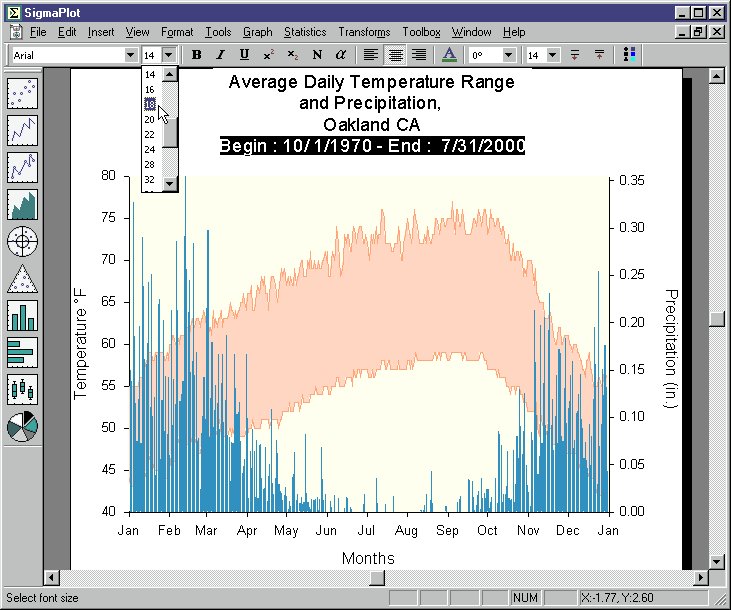
Quickly edit text directly on graphs with the new text formatting toolbar.
Click to view larger image
Now editing text on your graphs is as easy as using a word processing program! You can type or edit text right on the page. Change axis labels, titles, legend text or text annotations by double-clicking the text you want to edit. Select your text, then change font size, type, color and alignment with easy-access buttons in the toolbar.
- Type or edit text directly on the page like a word processor when changing axis labels, titles, legend text or free-form text.
- Select your text, then change font size, type, color and alignment with intuitive buttons visible from the toolbar.
Gain more control over legends with new improvements

Click to view larger image
Now you can choose to lock or unlock your legends when making changes to your worksheet. Change column titles or use new data without resetting your legend. Just select the checkbox option in the graph properties box to lock your legend while you edit your graph or data. Choose individual legend items to display with new checkbox controls. Lock legend text so that changes to your worksheet don't affect the legend labels. New controls to show/hide individual legend labels.
Easily insert Microsoft objects on your graphs
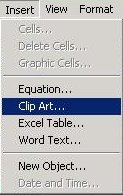
Insert equation, Clip Art, Word text, and Excel on graphs or reports.
Place regression equations, clip art, Microsoft Excel tables and Microsoft Word text or MS Equation Editor objects right onto your SigmaPlot graphs and reports. Just select the option from the insert drop-down menu to quickly place an equation or object on your page.
Multiple Undo, Autosave, Nudge and more
- Multiple Undo - Undo several changes to experiment with different annotations on your graphs.
- AutoSave -SigmaPlot 8.0 automatically saves a backup file every 10 minutes - or customize your own backup
- Nudge - Move graphical objects with keyboard arrow keys.
- New Export dialog - Supply the size of the image you want, and automatically calculate the optimal DPI.
- MS Access .MDB file import
- Windows XP, ME support